My uncle recently asked me a variant of this question, and I learned a few new things after doing some wikipedia research. Here is my attempt to explain it using language everyone can understand.
Part of what makes the internet work at all is that it is designed to be distributed — there is as little hierarchical control as possible. The big idea is to let anyone connect to anyone without going through some commander at the top. If everyone had to go through the top, then it would become a huge bottleneck.
A “web host” usually means any company that hosts web pages. This just means that they own computers that are connected to the Internet. Of course, your everyday desktop computer is also connected to the internet, but for a variety of technical and financial reasons it usually makes more sense to go through a “web hosting” company if you want a web site that is going to be available 24/7 to anyone in the world. But the point is, anyone can connect a computer to the internet, and thus anyone can be a web host — there are no qualifications. And that is part of why the Internet works at all.
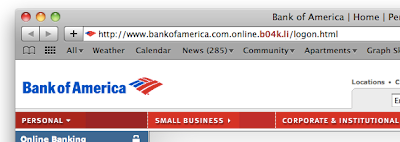
However, the story is different for getting domain names. For domain names, some hierarchy is unavoidable, because you need some central way to determine who controls which names and which websites they point to. You want to be sure that “amazon.com” always goes to amazon and not “buy-stolen-belts-for-cheap.com”. In other words, you need to direct people to the right internet-attached computer. (There is also some hierarchical control needed for various other technical pieces of the Internet.)
According to the wikipedia articles, the US Department of Commerce is theoretically in charge of overseeing those aspects of the Internet that need some hierarchical control. However, they outsource the entire job to a non-profit corporation called ICANN – the Internet Corporation for Assigned Names and Numbers, which for historical reasons is based at the University of Southern California. ICANN has the authority to (1) make certain policy decisions, and (2) outsource the management of sets of domain names — like those ending in “.com”, “.org”, or “.net” — to various other companies. For example, a company called VeriSign is in charge of handling all “.com” domain names, because they won that contract from ICANN. (Part of the contract specifies certain rules, such as limits on the fees they can charge.) But VeriSign, in turn, only handles the actual repository of domain names, and outsources the job of actually dealing with customers to still other companies! But those other companies have to be “accredited” according to certain standards set by ICANN.
For example, I have control of the domain name “robinstewart.com”. I used a company called DreamHost to process that registration and collect payment of $9.95 per year. Part of that money (about $3) goes to DreamHost, for dealing with me, the customer. Part of it (about $6.50) goes to VeriSign, for keeping track of all the “.com” domain names and making sure there are no conflicts. And a very small part of it (20 cents) goes to ICANN, to continue to make policies and track down anyone abusing the system.
So there is a large hierarchy of organizations who all basically operate under the authority of ICANN, which in turn has some sort of mandate from the US government. And there are some international governance boards and treaties, but for various political reasons (i.e. the system is working, so why change it) the whole thing remains US-based.
And there you have it.